API Analytics

Go beyond performance and operational API metrics. See everything that matters to your business. Explore essential growth and usage metrics in a fully customizable dashboard!

Real-time data! For real data-driven decisions about your APIs.

Customize. Analyze. Decide.

Make faster data-driven decisions with engineering, product, QA, and growth metrics about your API consumers. Easily customize the dashboard with data that is relevant to you.
Recent requests
Top countries
Top cities
Requests per day
Requests map
Top devices
Weekly breakdown
Monthly breakdown
App versions
Error ratio
Average load time
Average response size
Performance per day
Execution time
Work with Fresh API Data

API Performance Tracking

Get alerted in real-time about spikes, problems or slowdowns on any device.

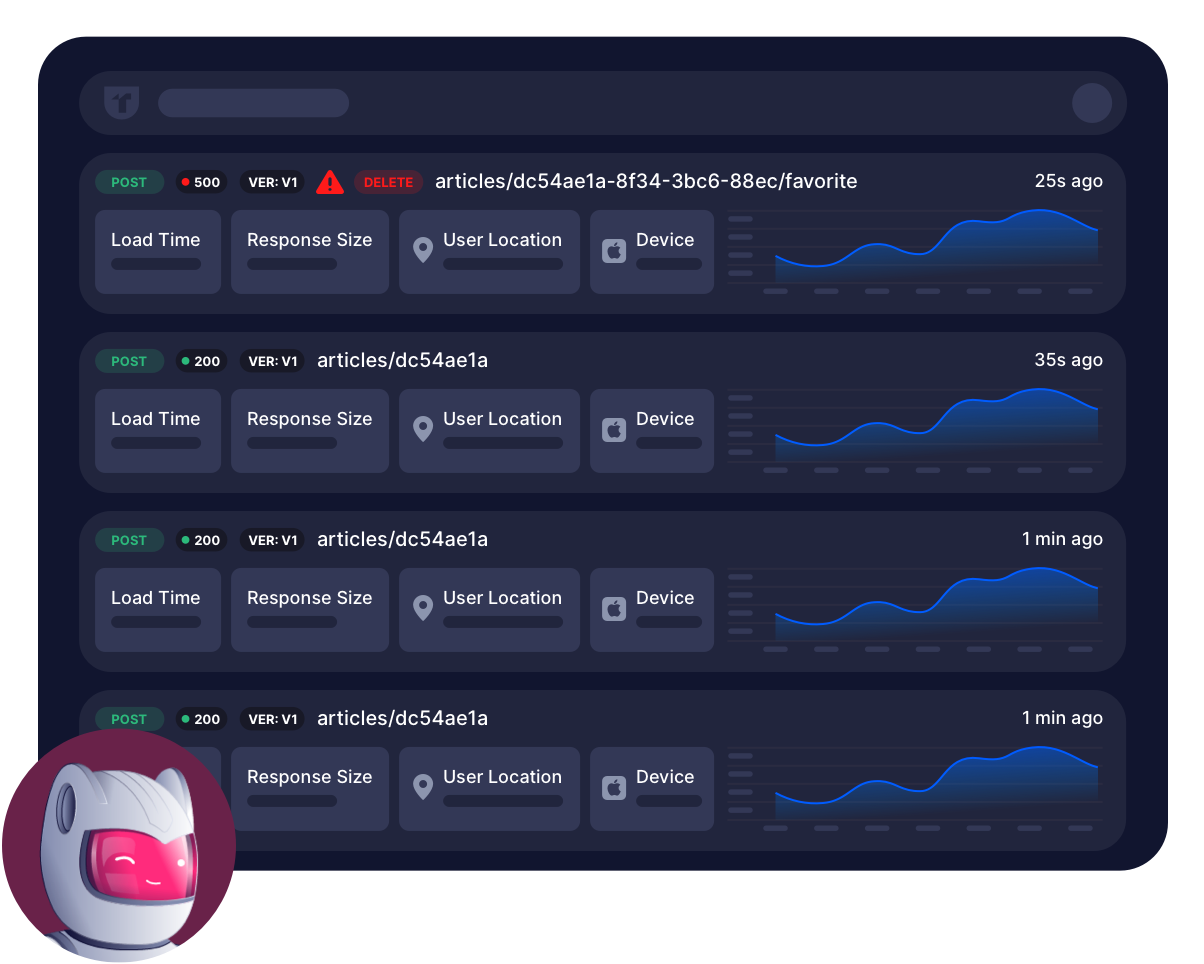
See which endpoints are used the most and have the biggest impact on your API.

Get geographic and device insights in real-time.

Connect the dots with ease

API Growth Driver

Analyze usage trends & patterns for data-driven decisions.

Visualize API call patterns to identify spikes, trends, and potential bottlenecks.

Map usage behavior to product features with endpoint detection and aliases.

Tailor it to suit your needs

Customizable Project Dashboard

Build custom analytics dashboards specific to your needs.

Choose from a gallery of predefined and easy to use widgets.

Easily create custom widgets with data that is relevant to you.

Learn more with these resources

Testimonials

Best API-first Engineering Teams Use Treblle

Discover More Products

Find out more about Treblle products and scale your APIOps by accelerating API development and maintenance.

Stay ahead with real-time API-metrics data.

Start scaling your APIs today.

FAQ

Frequently Asked
Questions on API Observability

What is API analytics?
How can API analytics help with scaling APIOps?
What is API-first?
How real-time is the data in API analytics?
Do you support analytics for both REST and GraphQL APIs?